VENN DIAGRAM
A Venn diagram is a simple graphic organizer made up of circles that overlap to enable a student to visualize similarities and differences of a particular concept. Each area or zone of the diagram represents a concept related to the designated concept of discussion. Students quickly learn to analyze similarities and differences related to any given topic.
This is a universal tool, as it can be used with any area of curriculum, which makes it highly useful. By the time a student is in grade 9, he or she will be very familiar with this format. It can be used with as few as two circles, or as many as a lesson requires.
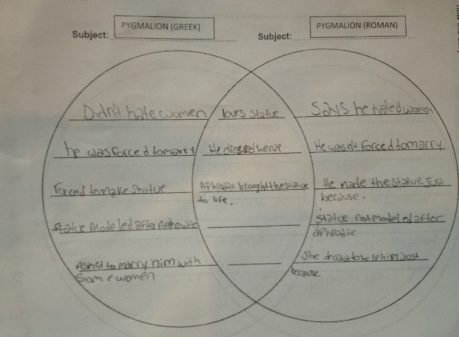
The example shown was used in a lesson that I taught comparing mythological fables. In this lesson the students compared the Greek version of the fable of Pygmalion to the Roman version. Students used the Venn diagram to compare and contrast the differences and similarities between the two myths.
This is a universal tool, as it can be used with any area of curriculum, which makes it highly useful. By the time a student is in grade 9, he or she will be very familiar with this format. It can be used with as few as two circles, or as many as a lesson requires.
The example shown was used in a lesson that I taught comparing mythological fables. In this lesson the students compared the Greek version of the fable of Pygmalion to the Roman version. Students used the Venn diagram to compare and contrast the differences and similarities between the two myths.
